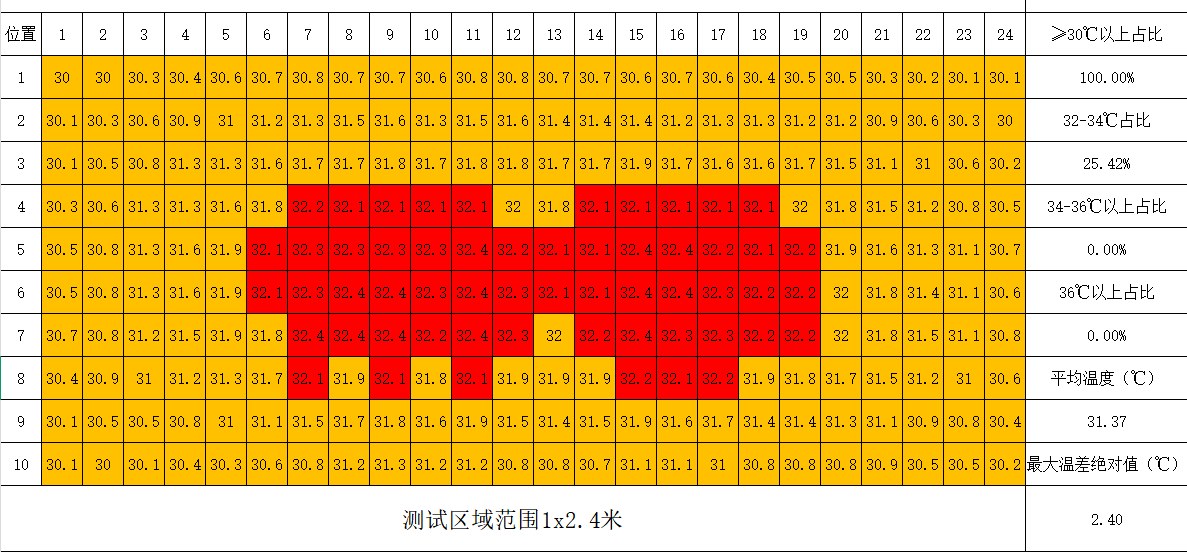
Thermal measurement record for a 1.0 × 2.4 m graphene-on-mica heating panel: 240 grid points, average 31.37°C, maximum spread 2.40°C

Case Studies / Engineering case study · piglet heating panel

Piglet Heating Panel: Large-Area Thermal Uniformity Validation

Client-qualified overhead piglet heating panel — a 220-point thermal-map validation of two graphene-on-mica builds, from V1 prototype to the qualified V2 configuration.

Measurement points on the 0.5 × 1.1 m receiving plane (10 × 22)
220
Maximum temperature spread, V1 to qualified V2
8.20 → 6.00°C
Points above 37°C after the circuit redesign
4.55% → 0%
Coldest corner point
29.9 → 30.9°C

Engineering case study / Overview

This case study documents the thermal qualification of an overhead graphene heating panel for a piglet creep area. Two prototype builds of the small panel — V1 and V2 — were mapped on the same 220-point grid over the heat-receiving plane, 500 mm below the suspended panel. V2 was accepted by the customer as the qualified configuration. A separate 240-point record for a 1.0 × 2.4 m large-panel build is included as supporting evidence. The heating element is a graphene layer printed on a mica board. The customer is not named in any published record.

Panel-level qualification record. Measurements describe the receiving plane 500 mm below the suspended test panels under stated inputs — not finished-product surface temperatures, animal outcomes, or long-term field performance. The customer is not named.

01 / Engineering challenge

Heating a Creep Area, Not a Single Point

Newborn piglets in a creep area need a broad, even warm zone rather than a single hot spot. An overhead radiant panel has to deliver that zone from a fixed suspension height, while keeping a clear upper temperature limit and a practical power budget.

A reading from one sensor cannot show whether the rest of the creep area reaches the intended band. Concentrated hot points and cold corners both remain invisible without a defined grid.

For this project the question was therefore put to the full receiving plane: with the panel suspended 500 mm above the mat, how is temperature actually distributed across the 0.5 × 1.1 m zone below it — and can that distribution be improved by redesigning the printed circuit pattern?

The engineering questions

The answer was required as a measured record, not a description: two identified builds, one unchanged method, and a side-by-side comparison of the full field.

02 / Qualification protocol

A 220-Point Grid Over the Receiving Plane

The panel was suspended 500 mm above the heat-receiving mat. Temperature was recorded at 220 fixed points arranged in a 10 × 22 grid across a 0.5 × 1.1 m plane.

Two builds were compared using the same grid and suspension height: the V1 prototype (220 V, 175 W rated, 178 W measured) and the V2 build with the redesigned printed circuit pattern (220 V, 200 W input).

Recorded test parameters

ParameterValue
ApplicationPiglet creep area — overhead radiant heating
Heating technologyGraphene heating layer printed on a mica board
Supply voltage220 V
V1 input175 W rated / 178 W measured
V2 input200 W
Suspension height500 mm above the heat-receiving mat
Mapped surface0.5 × 1.1 m receiving plane (not the panel face)
Measurement grid220 fixed points — 10 rows × 22 columns
ControlTemperature controller with temperature sensor

The record states voltage, measured power, suspension height, grid size and the mapped plane. It does not state ambient temperature, stabilization time, measurement instrument, sensor accuracy or sampling interval; those details should be added to future published records. The V1 sheet also carries panel-body spot readings — the emitting underside above 130°C and the upper side at 63.2°C — which are properties of the panel itself and are distinct from the 220-point field below it.

03 / Measured results

V1 to V2: The Same Grid, a Different Field

The two maps below are redrawn from the original test records with the customer name removed. Every cell is the recorded temperature at that grid point, in °C; the statistics are the values printed on the source sheets.

Only the printed circuit pattern changed between V1 and V2. The heating technology (graphene on mica), the 220-point grid, the 500 mm suspension height and the 220 V supply were held constant.

V1 Initial prototype build

V1 Prototype — Receiving-Plane Thermal Map

500 mm suspension height · 220 V · 175 W rated / 178 W measured · receiving plane 0.5 m × 1.1 m · 220-point grid (10 × 22)

  • 33.75°CAverage
  • 29.9–38.1°CRange
  • 8.20°CMax spread
  • 4.55% (10 pts)Above 37°C
  • 75.00%At/above 32°C
  • < 30°C
  • 30–31.9°C
  • ≥ 32°C

Redrawn in English from the original client test record; customer name removed. Cells show recorded temperatures to one decimal place; statistics are the record’s own printed totals. V1 band “above 37°C” follows the source sheet (4.55%, 10 points).

V2 Client-qualified configuration

V2 Qualified Configuration — Receiving-Plane Thermal Map

500 mm suspension height · 220 V · 200 W input · receiving plane 0.5 m × 1.1 m · 220-point grid (10 × 22)

  • 33.22°CAverage
  • 30.9–36.9°CRange
  • 6.00°CMax spread
  • 0.00% (0 pts)Above 37°C
  • 65.91%At/above 32°C
  • < 32°C
  • ≥ 32°C

Redrawn in English from the original client test record; customer name removed. Cells show recorded temperatures to one decimal place; statistics are the record’s own printed totals. V1 band “above 37°C” follows the source sheet (4.55%, 10 points).

Side-by-side record statistics

MetricV1 — initial prototypeV2 — qualified configuration
Measured input175 W rated / 178 W measured200 W
Average plane temperature33.75°C33.22°C
Peak grid point38.1°C36.9°C
Coldest grid point29.9°C (two corners)30.9°C
Maximum temperature spread8.20°C6.00°C (−26.8%)
Points above 37°C4.55% (10 points)0.00% (0 points)
Points at or above 32°C75.00%65.91%

The above-32°C share is lower in V2 by design: the V1 centre ran above 37°C while two corners sat at 29.9°C. The redesign moved output out of the central hot core toward the perimeter — colder corners lifted, hot points disappeared, and the overall spread narrowed by 26.8%. The record supports redistribution on these two builds; it does not predict the outcome of any other pattern change.

01

The hot core disappeared

V1 concentrated heat in the central grid paths: 10 points read above 37°C, with two at 38.1°C. On the same 220-point grid, V2 has zero points above 37°C and a peak of 36.9°C.

02

Both cold corners were lifted

The two V1 corner points at 29.9°C were the coldest locations on the plane. In V2 the coldest point anywhere is 30.9°C — every one of the 220 points reaches at least 30.9°C.

03

Flatter field at higher input

Input rose from 178 W measured to 200 W (about 12%), yet the peak fell and the maximum spread narrowed from 8.20°C to 6.00°C. Extra power was distributed toward the edges rather than piled onto the centre.

04

The average moved slightly — on purpose

The V2 average, 33.22°C, is 0.53°C below V1’s 33.75°C. Trimming the over-hot centre and lifting the corners produces that small trade in the mean; the field is bounded at both ends instead.

04 / Available configurations

Panel Lineup for Swine Housing

The qualified panel architecture is available as two standard overhead configurations for swine housing, with dimensions, voltage, power and control options customizable for OEM projects.

Configuration Panel size Power Voltage Mounting Designed zone
Piglet creep panel300 × 600 mm≤175 W per panel220 VOverhead, about 500 mmDesigned zone 35–40°C
Grower / finisher panel1000 × 400 mm≤220 W per panel220 VOverhead, about 900 mmDesigned zone 31–36°C
Large-area validation build1000 × 2400 mm210 W (as recorded)220 VOverhead, 900 mm240-point record: 2.40°C spread

These are production specifications, separate from the qualification record above. The 220-point maps describe the 0.5 × 1.1 m receiving plane at 500 mm for the V1 (178 W) and V2 (200 W) test builds; they should not be read point-for-point onto a production 300 × 600 mm panel. All configurations use a graphene layer printed on mica board and are supplied with a temperature controller and sensor. Custom dimensions, power levels, voltages and mounting arrangements are evaluated per project; ask for the configuration-specific test record.

05 / Supporting evidence

The Same Method on a 1.0 × 2.4 m Build

The same grid-mapping method was applied earlier to a much larger 1.0 × 2.4 m overhead build for grower/finisher areas, with the receiving plane mapped 900 mm below the panel at 240 points (10 × 24).

The first build ran two independent circuits (left: 202 V / 222 W; right: 197 V / 221 W) and left three points just below 30°C. The improved build evened those out: all 240 points reached 30°C or more at 210 W total input.

Two identified large-panel builds

MetricFirst build — dual circuitsImproved build
Input powerTwo circuits: 222 W + 221 W (202 V / 197 V)210 W total
Mapped plane / suspension1.0 × 2.4 m at 900 mm1.0 × 2.4 m at 900 mm
Grid points240240
Average temperature31.47°C31.37°C
Temperature range29.5–32.4°C30.0–32.4°C
Points at or above 30°C98.75% (3 points: 29.5 / 29.8 / 29.9)100%
Maximum spread3.00°C2.40°C
Panel-body spot readings91.1 / 36.8°C and 87.5 / 40.6°C (underside / upper side, two circuits)Not recorded on the sheet
Thermal measurement record of the improved 1.0 × 2.4 m graphene-on-mica panel build: 240 points, maximum spread 2.40°C, average 31.37°C
Improved large-panel build, receiving plane at 900 mm suspension: 1.0 × 2.4 m, 240 points, every point at or above 30°C, average 31.37°C, maximum spread 2.40°C, 210 W total input.

Both large-panel sheets map the receiving plane 900 mm below the suspended panel; the panel-body readings are separate spot checks on the board itself. Neither sheet establishes installed field performance. The original sheets name the customer; only the unnamed record image is published.

06 / Engineering principles

What the Qualification Was Built On

Three principles behind the qualification, applicable to any overhead heating-panel programme.

Principle 01

Define the mapped surface first

The panel face and the receiving plane are different surfaces. This record maps the plane the animals actually occupy — 500 mm (small panel) or 900 mm (large panel) below the board — because that is the surface that matters to the application.

Principle 02

Judge uniformity from the full set

Average temperature alone hides both hot and cold tails. Spread, the above-upper-limit share, corner minima and coverage are read together from one grid taken under one set of conditions.

Principle 03

Separate records, specifications and claims

The 220- and 240-point sheets are panel-level records; the 300 × 600 mm and 1000 × 400 mm line items are production specifications; anything about animals, ingress protection or long-term field life would be a different evidence class entirely and is not claimed here.

07 / Validation scope and limitations

What the Records Demonstrate — and What They Do Not

This page separates panel-level thermal records from production specifications, and makes no claim outside either.

Supported by the records

  • V1 receiving plane: 220 points, 29.9–38.1°C, average 33.75°C, spread 8.20°C, 4.55% of points above 37°C, at 220 V (175 W rated / 178 W measured) and 500 mm suspension.
  • V2 receiving plane: 220 points, 30.9–36.9°C, average 33.22°C, spread 6.00°C, zero points above 37°C, at 220 V / 200 W and 500 mm suspension.
  • V1 panel-body spot readings: emitting underside above 130°C, upper side 63.2°C.
  • Large-panel builds: 240-point maps at 900 mm with 3.00°C and 2.40°C maximum spread; the improved build reached 100% of points at or above 30°C at 210 W.
  • Production configurations: 300 × 600 mm (≤175 W) and 1000 × 400 mm (≤220 W) graphene-on-mica panels at 220 V with controller and sensor.

Outside the scope of this case study

  • Animal health, welfare, survival-rate, growth or sleep outcomes — no animal study was conducted.
  • Far-infrared wavelength, emissivity or spectral claims — no emissivity or spectral test report is cited for these panels.
  • Ingress-protection ratings (for example IP67) or washdown certification.
  • Specific sensor curves, thermal-cutoff devices or other component-level approvals not shown in the record.
  • Finished-system safety certification or regulatory approval.
  • Long-term durability, field reliability or running-cost comparisons against heat lamps.

V2 is the customer-qualified configuration. The published records are panel-level engineering evidence; finished-system verification and any field claims remain project-specific. Panel-level receiving-plane thermal records under stated test conditions. The figures describe the identified test builds only; they do not establish finished-product certification, ingress ratings, emissivity or spectral claims, animal outcomes, or long-term field performance. Production configurations are catalog specifications, not test results. The customer is not named.

08 / OEM development

Building a Panel Around Your Housing System

XIHE works with livestock equipment manufacturers and farm-system builders on overhead graphene heating panels for integration into their products.

A typical engineering discussion begins with the creep or housing area, the suspension height, and the temperature band the receiving plane has to meet.

  1. Step 1

    Define the creep area

    Share the pen geometry, suspension height, target temperature band for the receiving plane and the upper temperature limit.

  2. Step 2

    Agree electrical and control requirements

    Confirm voltage, per-panel power limit, controller and sensor requirements, and zoning for multi-panel installations.

  3. Step 3

    Review the panel design

    Evaluate mica-board dimensions, the printed circuit pattern and the mounting arrangement against the area to be covered.

  4. Step 4

    Define the acceptance grid

    Agree the point grid, suspension height, ambient conditions, stabilization time, acceptance limits and the record to be delivered.

  5. Step 5

    Validate the finished configuration

    Run the agreed grid on the final build, then carry out finished-system verification for the intended installation.

09 / Related solutions

Explore XIHE’s Heating Engineering Capabilities

Custom Graphene Heating Components

Heating films and panel architectures engineered around product geometry and OEM integration requirements.

Engineering Evidence

How heating performance, temperature distribution and other characteristics are evaluated with defined tests.

Technical Review

Discuss your application, suspension height, electrical requirements and acceptance grid with XIHE.

10 / Technical FAQ

Questions About the Piglet Heating Panel Qualification

Answers stay within what the records support: the 220-point maps, the available configurations, and OEM scope.

How was temperature uniformity validated for the piglet heating panel?

The panel was suspended 500 mm above the heat-receiving mat, and temperature was recorded at 220 fixed points in a 10 × 22 grid across a 0.5 × 1.1 m plane. Two builds — V1 and V2 — were mapped on the same grid under 220 V. V1 measured 178 W (175 W rated) and V2 ran at 200 W. The record reports average temperature, peak and coldest points, maximum spread and the share of points above 37°C for each build.

What changed between the V1 and V2 panels?

Only the printed circuit pattern; the graphene-on-mica heating technology, grid, suspension height and voltage were unchanged. The V2 field shows a peak of 36.9°C (versus 38.1°C), zero points above 37°C (versus 4.55%, 10 points), a coldest point of 30.9°C (versus 29.9°C at two corners) and a maximum spread of 6.00°C (versus 8.20°C) — even though measured input rose from 178 W to 200 W.

Why did the average temperature fall slightly after the redesign?

The V1 pattern concentrated output in the centre, which pushed the average up while creating hot points and cold corners. V2 redistributed output from the central core toward the perimeter, trimming points above 37°C and lifting the corners. The average moved from 33.75°C to 33.22°C, but the field became flatter at both ends — that was the objective of the change.

Can these panels replace heat lamps in a creep area?

They are designed as overhead radiant panels operating without visible-light glare, suspended 500 mm above the mat and controlled with a temperature sensor and controller. The qualification record establishes the receiving-plane temperature field; it does not include a controlled comparison of running costs or animal outcomes against heat lamps. For an equipment programme, XIHE recommends validating the selected configuration at the planned suspension height and control settings.

What piglet heating panel configurations are available?

Two standard graphene-on-mica overhead panels are offered: a 300 × 600 mm piglet creep panel at up to 175 W (about 500 mm suspension, designed for a 35–40°C zone) and a 1000 × 400 mm grower/finisher panel at up to 220 W (about 900 mm suspension, 31–36°C). Both are 220 V and supplied with a temperature controller and sensor. Dimensions, voltage, power and mounting can be customized; the 1.0 × 2.4 m, 210 W build exists as a mapped engineering record.

Do you claim animal-health benefits, far-infrared wavelengths or an IP rating?

No. The published evidence is limited to panel-level receiving-plane temperature measurements. XIHE makes no animal health, growth or survival-rate claims on this page, cites no wavelength or emissivity figures for these panels (no emissivity or spectral report is part of the record), and assigns no IP or washdown rating. Finished-system safety, ingress protection and installation compliance must be verified for the intended product and market.
Developing an Overhead Heating Programme?

Share the creep or housing area, suspension height, target temperature band, supply voltage and production volume. XIHE can review the requirements and propose a graphene-on-mica panel configuration with an agreed validation grid.

XIHE provides OEM-oriented panel and integration support. Finished-system performance, safety, ingress protection and compliance must be verified for the intended installation and market.