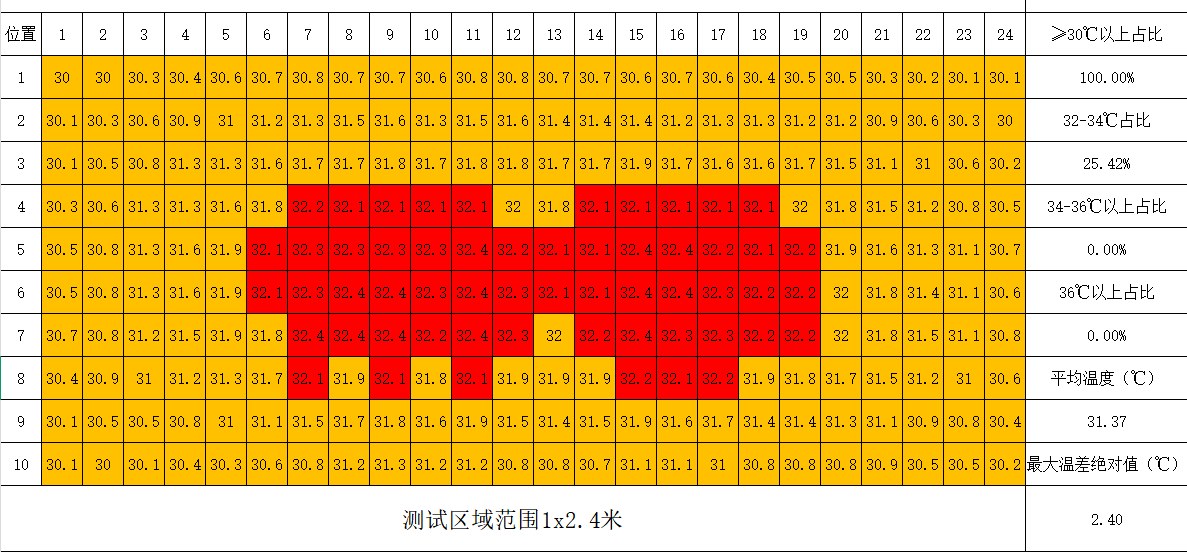
Thermal measurement grid of a 2.4 m² graphene heating panel: 240 temperature points with a maximum spread of 2.4°C

Case Studies / Engineering assessment

Piglet Creep Heating Panel

A graphene heating panel validated for piglet creep heating: 240 measurement points across 2.4 m², every point at or above 30°C, with a maximum spread of just 2.4°C. A circuit redesign then raised power by ~12% while lowering the peak temperature — uniformity engineered into the circuit pattern, not just the material.
01 / Product problem

A large-area graphene heating panel engineered for uniform thermal output.

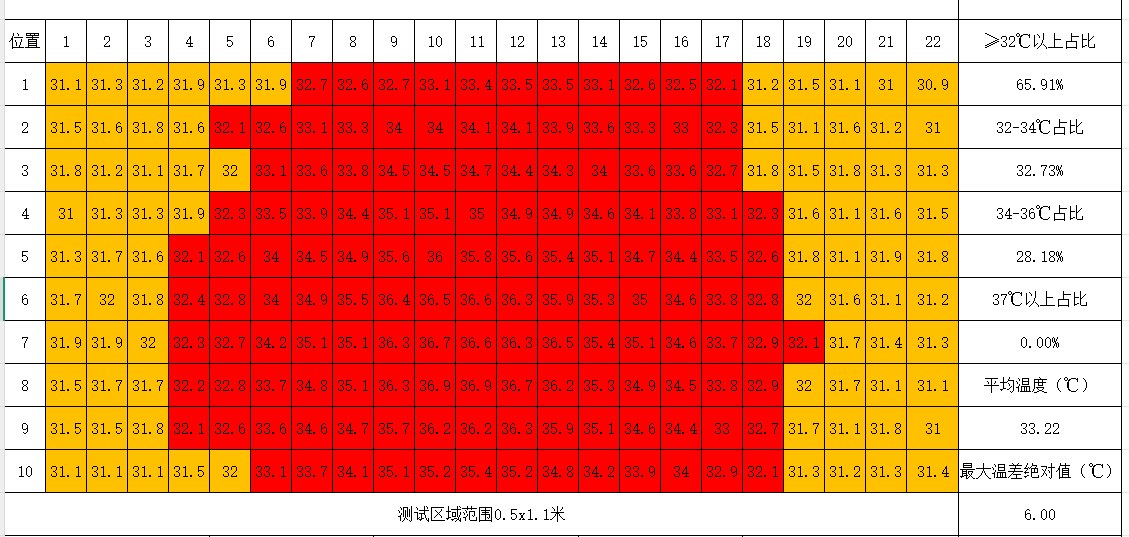
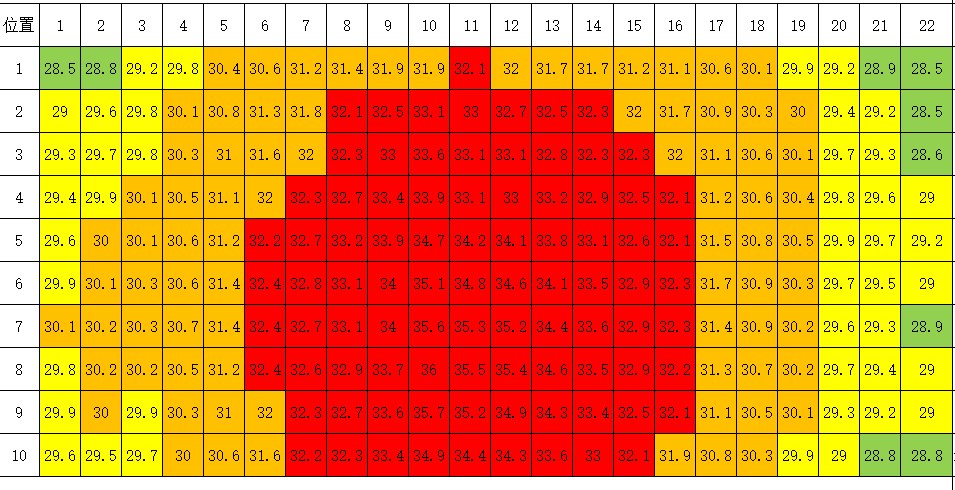
XIHE ran a panel-level thermal validation of a graphene heating panel built for piglet creep heating at a livestock producer. The customer is not named in this record. The 2.4 m² panel was measured on a fixed 1×2.4 m grid with 240 temperature points: every point read at or above 30°C, the average was 31.37°C, the maximum spread was 2.40°C, and total input was 210 W. Separately, a smaller panel went through a circuit-pattern redesign (V1→V2): input power rose by ~12%, peak temperature fell from 38.1°C to 36.9°C, and the share of surface above 37°C fell from 4.55% to 0.

Integration requirements

  • Define the heated area, the target temperature band and the acceptable temperature spread before the circuit pattern is drawn.
  • Match the circuit pattern to the panel geometry — heat has to be distributed across the surface, not just generated.
  • Specify the measurement grid and the acceptance rule (points, coverage, spread) that the validation record must satisfy.
  • Keep panel-level results separate from finished-product and field records; this record establishes the panel only.

Case record

Application & engineering tags

Project status

Development stage is not established by this assessment. Ask for the project-specific record during technical review.

Engineering assessment. Product imagery and proposed architecture do not establish tested performance or commercial development stage.

2.4°C

Maximum temperature spread across the 2.4 m² panel

240 / 100%

Measurement points — all at or above 30°C

210 W

Total input power over the 2.4 m² heating surface

38.1 → 36.9°C

Peak temperature after the V1→V2 circuit redesign

02 / Integration structure

Design the interfaces around the heater.

The circuit pattern sets the thermal map

V1 and V2 used the same graphene heating material. The only change was the circuit pattern — how current paths were laid out across the surface. Power rose by ~12%, yet the peak temperature dropped from 38.1°C to 36.9°C and the area above 37°C went from 4.55% to zero. The material generates the heat; the pattern decides where it goes.

Measure the whole surface, not a point

A single sensor can confirm that a panel is warm. It cannot confirm that a panel is uniform. The 2.4 m² record uses 240 fixed grid points: 100% at or above 30°C with a 2.40°C maximum spread. Uniformity is a property of the full measurement set, taken at one instant under defined input and ambient conditions.

Custom Heating Integration, in practice

This is what XIHE means by Custom Heating Integration: the heating layer is engineered around the application — circuit pattern, thermal distribution and target temperature together. The same approach applies wherever thermal uniformity matters: livestock equipment, outdoor infrastructure, technical textiles, heated wearables and industrial enclosures. Not just how much heat you can generate — where that heat goes.

Assembly detail

Trace the electrical and thermal paths.

The panel as validated: the heating layer, the circuit pattern that distributes its output, and the measurement grid that recorded it.

Panel-level thermal validation record. Test area 1×2.4 m; 240 measurement points; average 31.37°C; maximum spread 2.40°C; 100% of points at or above 30°C.

Graphene heating layer
The active electrothermal material; generates the heat.
Circuit pattern
Electrode and current-path layout across the panel; sets how heat is distributed over the 2.4 m² surface.
Panel carrier
Mechanical support defining the 1×2.4 m heated area.
Measurement grid
240 fixed points recording the panel surface at one instant — the acceptance record, not part of the product.

Thermal interpretation

Uniformity across the contact surface.

Spatial uniformity describes variation across an area. Control stability describes variation over time at one location.

Spread, not just average

The 2.4 m² panel averaged 31.37°C with a 2.40°C maximum spread; all 240 points read at or above 30°C. The average describes the level; the spread describes the uniformity. Both come from the same measurement set.

What the redesign changed

Raising power normally raises the peak. The V1→V2 redesign raised power by ~12% while the peak fell from 38.1°C to 36.9°C — the new circuit pattern redistributed the same material’s output more evenly.

What the record does not show

Panel-surface temperatures under test conditions. They do not establish finished-product surface temperatures, animal-level outcomes, or long-term field performance.

03 / Engineering validation

What could fail, and how to investigate it.

Proposed verification work. Test conditions and acceptance limits must be set for the specific assembly before testing begins.

Integration challengePossible physical mechanismProposed verification methodEngineering decision to evaluate
Local hotspot after a power increaseHigher input concentrates current in the existing pattern.Re-map the full grid after the redesign at the new input; compare peak temperature and the above-37°C share against the acceptance rule.Circuit pattern geometry and acceptance limits.
Edge or corner coolingPanel boundaries lose heat faster than the centre.Include edge and corner points in the grid — the 240-point record covers the full 1×2.4 m area, not just the centre.Measurement region definition.
Panel record mistaken for product approvalA panel-level result gets quoted as a finished-product claim.State the test conditions with every figure; keep panel, product and field records separate.Evidence scope and permitted wording.

Panel-level thermal validation under stated test conditions. The figures on this page describe the tested panels only; they do not establish finished-product safety, regulatory compliance, or field performance. The customer is not named in this record.

04 / Development stage

Development stage is not established by this assessment.

Confirm the project-specific stage and evidence before treating an assessment as a qualified production program.

Engineering handoff records

Explore the validation framework →

05 / Next step

Move from this record to your product decision.

Review component scope, check the Engineering evidence, and bring your project requirements to a Technical Review.

Graphene Heating Film

Review the component and supply scope.

Engineering Evidence

Define the validation record the decision needs.

Technical Review

Share the geometry, electrical input and development stage.

Related integration formats

Compare a Related Heating Assembly

Working on a similar assembly?

Share the product geometry, layer stack and operating conditions. We will review the heating architecture and the questions a sample needs to answer.

Start Technical Review