Livestock Heating Energy Efficiency: A Practical Evaluation Guide
Learn how to properly evaluate energy efficiency in pig heating systems using the three-factor method, Effective Target-Zone Watt Density, and grid-based uniformity measurement. Compare heating technologies on a level playing field.
QUICK ANSWER
Energy efficiency in livestock heating is not about the rated wattage on a label — it is about how much of that input power actually delivers useful heat to the target area, at the right temperature, with consistent coverage. This guide introduces a three-factor framework for fair comparison, the Effective Target-Zone Watt Density metric, a six-step benchmarking method, and engineering data from graphene heating panel projects (2.4 m² large-panel dual-feed vs single-feed, and edge-compensation V1/V2) showing how uniformity optimization — not raw wattage reduction — drives real efficiency gains.
Reference Signals
When comparing heating options for piglet creep areas or livestock barns, you will see no shortage of “Save 70–80% on energy” claims. What you will rarely see is how that number was measured, what it was measured against, and under what conditions.
This guide provides a structured, engineering-based framework for evaluating energy efficiency in livestock heating systems. Rather than adding another unqualified claim to the noise, it gives you the method and the metrics to compare different heating technologies on a level playing field.
The core idea is straightforward: energy efficiency in livestock heating is not about the rated wattage on a label. It is about how much of that input power actually delivers useful heat to the target area, at the right temperature, with consistent coverage.
Primary CTA — Request a Technical Review
Secondary CTA — Download the Benchmarking Worksheet
1. Why “Energy Savings” Claims Are Misleading in Livestock Heating
Every heating product on the market claims to be energy efficient. But “efficient” means very different things depending on how you measure it. In livestock heating, three misleading practices are especially common:
Rated wattage is treated as the whole story. A 250 W heat lamp and a 210 W heating panel may seem comparable in power consumption, but if one covers five times the usable area at the target temperature, the wattage number alone tells you almost nothing about efficiency. Input power only makes sense when you know what output you are getting for it.
A single center-point temperature stands in for the whole area. Infrared heat lamps create a concentrated hot spot in the center with rapid temperature falloff toward the edges. Measuring only at the center — where the lamp is brightest — makes the output look better than it is. Cold corners and uneven coverage are invisible to a single-point measurement. For piglets, those cold corners matter: they are where chilling and huddling happen.
Material-level data is presented as system-level efficiency. A heating element may have a high electro-thermal conversion ratio at the material level, but if a significant portion of that heat escapes upward through the back of the panel or radiates in directions that do not reach the animals, the material-level number does not reflect what the farm actually pays for.
The core issue: livestock heating efficiency must be measured as watts per unit of effectively heated area — not watts alone.
This guide introduces a three-factor framework for fair comparison, a metric called Effective Target-Zone Watt Density, and a six-step benchmarking method you can apply to any heating system.
2. The Three Elements of a Fair Efficiency Comparison
A meaningful efficiency comparison requires three elements to be defined and measured. Leave any one of them out, and the comparison becomes apples-to-oranges.
Element 1 — Measured input power, not rated power
The rated wattage on a product label is a nominal figure. Actual power draw varies with line voltage, ambient temperature, and component tolerance. For a fair comparison, use measured input power under actual operating conditions, taken with a calibrated watt-meter at the supply line.
Element 2 — Effective heat output and how it was measured
“Heat output” is only useful if it reaches the animals at the right temperature. This requires defining:
- Target temperature window: The desired temperature range at animal level (e.g., 30–36°C for neonatal piglet creep areas).
- Measurement method: A grid-based temperature survey at the receiving plane (animal height), not a single center-point reading.
- Coverage ratio: The percentage of the target area that falls within the target temperature window.
A heater that delivers 95% coverage within the target window is more efficient than one that delivers 50% coverage at the same power input — even if both have the same rated wattage.
Element 3 — Complete test conditions
Efficiency numbers are meaningless without context. At minimum, record:
- Ambient room temperature during the test
- Ventilation rate or draft conditions
- Mounting height / distance from heater to animal level
- Floor type and insulation beneath the heated area
- Enclosure / creep pen dimensions and materials
Two heaters with identical input power can produce very different effective heating results when the installation conditions differ.
Introducing: Effective Target-Zone Watt Density
The fairest way to compare heating efficiency across different technologies is to normalize power input against the area that actually meets the temperature target. We call this metric the Effective Target-Zone Watt Density:
Engineering Definition — Effective Target-Zone Watt Density (W/m²)
= Measured Input Power (W) ÷ Effective Target-Zone Area (m²)
Where:
- Measured Input Power = actual power draw at operating voltage, measured with a watt-meter
- Effective Target-Zone Area = the portion of the heating footprint where receiving-plane temperature falls within the defined target window (e.g., ≥ 30°C and ≤ 37°C for piglet creep areas)
- Unit: W per m² of in-spec target zone
Why this metric matters: A 250 W heat lamp may appear “low wattage” on paper, but if only 0.5 m² of its footprint actually reaches the target temperature, its effective watt density is 500 W/m². A 210 W heating panel that delivers 2.4 m² of in-spec target area works out to 87.5 W/m² of effective area — roughly one-sixth the effective watt density.
Illustrative comparison (not a standardized head-to-head test)
Scenario (illustrative) Input Power Effective Target-Zone Area Effective Watt Density 250 W infrared heat lamp (estimated effective zone) 250 W ~0.5 m² ~500 W/m² 210 W large-area heating panel (measured) 210 W 2.4 m² 87.5 W/m² Important: The heat-lamp figures above are rough estimates for illustration only, not from a controlled head-to-head test. Real heat-lamp performance varies by lamp wattage, fixture type, mounting height, and reflector design. The purpose of this comparison is to explain the metric — not to make a definitive product claim.
The Effective Target-Zone Watt Density metric levels the playing field. It does not care whether the heater is a lamp, a panel, a mat, or a floor-heating system. It asks one question: for every watt you put in, how many square meters of properly heated animal area do you get back?
3. Temperature Uniformity: The Hidden Driver of Efficiency
Energy efficiency and temperature uniformity are deeply connected — more than most people realize. The reason is simple:
- Hot spots are wasted energy. Any area that exceeds the target temperature window represents power that is being spent beyond what is needed. In a piglet creep area, temperatures above ~37°C provide no additional benefit and may even cause avoidance behavior. The watts generating those overheated zones are effectively wasted.
- Cold spots are unmet need. Areas below the target temperature mean the heating system is failing to do its job across part of the intended footprint. Piglets huddle away from cold corners, concentrating in smaller zones — which means part of your heating investment is paying for empty floor space.
- Poor uniformity forces you to over-size the system. When a heater has a large hot center and cold edges, the natural response is to crank up the power so the edges barely reach the target. But this makes the center even hotter, wasting even more energy. It is a vicious cycle.
Better uniformity means more of the input power is doing useful work. This is why efficiency improvements often come from better heat distribution — not from adding more power.
Case Study: How Cutting Power by Half Improved Coverage
In a large-area livestock heating panel developed for swine creep heating, two build configurations were tested under identical conditions to isolate the effect of circuit design and power feed architecture on thermal uniformity and effective coverage.
Identical test conditions for both builds:
- Panel: 2.4 m² (1.0 m × 2.4 m), rigid panel construction
- Suspension height: 900 mm above the measurement plane
- Measurement: 240-point receiving-plane grid (24 × 10)
- Target threshold: ≥ 30°C at receiving plane
- Voltage: 220 V
| Metric | First Build (Dual-Feed) | Improved Build (Single-Feed) | Change |
|---|---|---|---|
| Total input power | 443 W (222 W + 221 W, dual-zone) | 210 W (single-zone) | −52.6% power |
| Receiving-plane temperature (min) | 29.5°C (3 points below 30°C) | 30.0°C | +0.5°C at coldest point |
| Coverage ≥ 30°C | 98.75% (237 / 240 points) | 100% (240 / 240 points) | Cold spots eliminated |
| Max ΔT (max − min) | 3.0°C | 2.4°C | ΔT narrowed by 20% |
| Average temperature | 31.47°C | 31.37°C | −0.10°C (nearly identical) |
What happened here? The First Build used a dual-feed design with two independently powered zones totaling 443 W. The Improved Build used a redesigned single-feed circuit pattern at 210 W — less than half the power. Yet the lower-power version delivered:
- Better minimum temperature (coldest point rose from 29.5°C to 30.0°C)
- 100% target coverage (up from 98.75% — the 3 cold spots were eliminated)
- Tighter uniformity (ΔT narrowed from 3.0°C to 2.4°C)
- Virtually identical average temperature (31.37 vs 31.47°C — difference within measurement noise)
The power was cut by more than half, yet heating performance improved. This is counter-intuitive until you realize: the dual-feed design was pushing too much power into center zones that were already warm, while leaving edge areas under-heated. The single-feed redesign redistributed the current so that heat was spread more evenly across the entire 2.4 m² surface. The result: more of the input energy goes toward useful heating, and less is wasted on over-heating the center.
Important qualification — Data above is from a specific 2.4 m² livestock heating panel project under defined test conditions (receiving-plane temperature measured at 900 mm vertical distance from the panel surface, 240-point grid, 220 V input). This is project-specific data, not a universal specification. Uniformity performance varies by heater size, shape, power density, substrate, and measurement method. The two builds were tested in the same facility with the same grid setup to isolate the design variable.
The Edge Compensation Principle
Another example of the uniformity-efficiency link comes from a smaller rigid graphene-on-mica panel (mapped across a 0.5 m × 1.1 m, 0.55 m² receiving-plane footprint at 500 mm suspension height) in the same product family. Two design iterations were compared under identical test conditions:
Identical test conditions for both iterations:
- Panel: rigid graphene-on-mica panel
- Receiving-plane footprint: 0.5 m × 1.1 m (~0.55 m² measurement area)
- Suspension height: 500 mm above the measurement plane
- Measurement: 220-point receiving-plane grid (10 × 22)
- Voltage: 220 V
| Metric | V1 Prototype | V2 (Edge-Compensated) | Change |
|---|---|---|---|
| Input power | 178 W | 200 W | +12% more power |
| Hottest point | 38.1°C (center) | 36.9°C | −1.2°C (peak went down) |
| Coldest point | 29.9°C (corners) | 30.9°C | +1.0°C (floor went up) |
| Max ΔT | 8.20°C | 6.00°C | −26.8% tighter |
| Points above 37°C | 4.55% (10 points) | 0% (0 points) | Hot spots eliminated |
The V2 iteration actually draws 12% more power than V1, yet the peak temperature is lower and uniformity is dramatically better. How is that possible? Through edge compensation — adjusting the printed circuit pattern so that power density is slightly higher at the perimeter, where heat loss to the surrounding environment is greatest.
In V1, the center ran hot and the corners ran cold. In V2, current density was redistributed from the over-heated center toward the edges. The result: the hottest zone cooled down, the coldest corners warmed up, and ΔT narrowed by nearly 27%. The total power went up slightly, but a much larger fraction of it is doing useful work within the target temperature window.
Different test conditions — not directly comparable — The 2.4 m² large-panel data (900 mm / 240-point grid) and the small-panel data (0.55 m² receiving-plane footprint, 500 mm / 220-point grid) were tested under different conditions with different panel sizes. They are presented as separate case examples and should not be compared side-by-side as equivalent measurements. Each demonstrates a different aspect of uniformity optimization.
Related case study — View the full 220-point and 240-point receiving-plane thermal maps in our Piglet Heating Panel Validation Case Study.
The engineering takeaway
Both cases point to the same conclusion: efficiency optimization is not about reducing total power — it is about reducing wasted power. A well-designed heating system puts watts where they are needed and avoids putting them where they are not. The circuit pattern, the feed architecture, and the edge compensation strategy all matter at least as much as the raw wattage number.
4. Material-Level Performance: What Graphene Brings
When evaluating any radiant heating technology, it is important to distinguish between three levels of performance: material-level, panel-level, and system-level. Material-level properties set the theoretical ceiling; panel construction and system design determine how much of that ceiling is actually realized in practice.
Far-infrared emissivity
Graphene heating films have a measured far-infrared emissivity of 0.88 (normal total emissivity, NIQS certified, 5–15 μm wavelength band, peak at approximately 9.4 μm).
What this means in practical terms:
- More of the heat energy is emitted as infrared radiation rather than conducted or convected away
- The 5–15 μm band overlaps with the absorption spectrum of organic matter — meaning the radiation is absorbed directly by objects and animals rather than heating the air in between
- For livestock applications, this direct radiant transfer reduces the amount of energy lost to air movement and ventilation
Boundary note — Emissivity of 0.88 is a material-level measurement on bare graphene heating film. It characterizes the radiation property of the material itself, not the delivered temperature or heating efficiency of a finished panel. Finished-panel performance depends on encapsulation layers, substrate type, panel construction, and operating conditions.
Directional thermal distribution: Why “top-side heat loss” matters
An often-overlooked efficiency factor is which direction the heat goes. A heating panel that radiates equally upward and downward wastes roughly half its energy heating the ceiling instead of the animals below.
At the material level, graphene heating films have:
- >99% total electro-thermal conversion efficiency — virtually all the electricity becomes heat (Joule heating, material-level)
- 68% electro-thermal radiation conversion efficiency — the share of input electricity that is converted to useful infrared radiation in the forward direction (material-level, NIQS-tested; industry threshold ≥ 55%)
But the material-level number is only part of the story. At the panel level, the construction and backside insulation determine how much of that heat is directed toward the animals versus lost through the back of the panel.
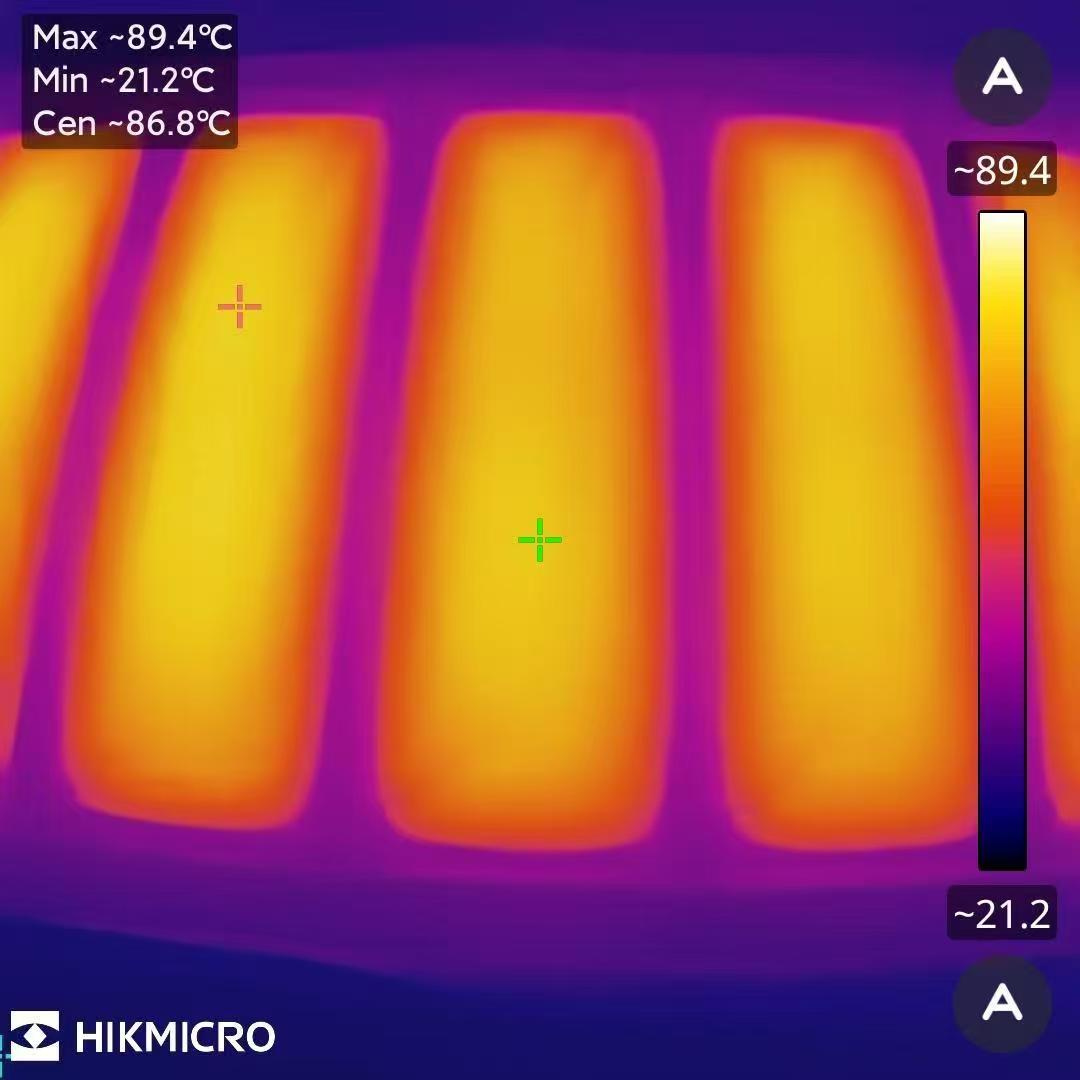
In thermal imaging of livestock heating panels during operation, the bottom (emitting) surface runs significantly hotter than the top (back) surface. As measured at panel corner edge points during testing:
- On a small rigid graphene-on-mica panel (V1 configuration, 178 W input): bottom corner temperature > 130°C vs. top corner temperature ~63.2°C
- On a large 2.4 m² panel (dual-feed first build, 443 W input): bottom corners 87–91°C vs. top corners 36–41°C
Engineering note on these temperature readings — The figures above are corner edge-point temperatures measured at or near electrode termination locations, which run hotter than the general panel surface due to current concentration at bus bar connections. They are not average surface temperatures for the entire top or bottom face. However, the consistent pattern — bottom side substantially hotter than top side — does confirm directional heat distribution toward the animal side of the panel.
These are project-level measurements from specific panel configurations. The exact temperatures vary by panel size, power input, substrate type, and measurement location.
The practical implication for energy efficiency:
- Material emissivity (0.88) determines how well the heating surface radiates energy
- Panel-level directional distribution (bottom >> top) determines how much of that radiation reaches the intended target
- Together, they determine the real system-level efficiency — what fraction of your electricity bill actually delivers useful heat to the animals
A panel with high emissivity but poor directional insulation will still waste energy upward. Conversely, a panel optimized for downward heat delivery — with appropriate backside insulation and a thermally reflective top layer — directs a larger share of input energy toward the animals, reducing waste.
Thermal stability
For long-term efficiency, the heating material must maintain consistent power draw over time. A heater whose resistance drifts significantly will either draw more power (wasting energy) or produce less heat (losing performance).
Graphene heating film shows < 3.4% resistance change after 240 hours of continuous energization at rated conditions (material-level, bare film testing). This indicates good thermal stability, which helps maintain consistent energy efficiency over the heater’s service life.
Boundary note — Thermal stability data is from material-level testing on bare film. Actual product-level lifetime depends on operating temperature, encapsulation, environmental exposure, and duty cycle. The 240-hour figure is not a product lifetime rating.
5. Comparing Livestock Heating Technologies
There is no single “best” heating technology for livestock. Each approach has different characteristics that make it more or less suitable depending on the application — animal age, pen size, barn environment, budget, and management style all factor in.
Below is a framework for comparing the major heating technologies used in swine and poultry production. The comparison focuses on engineering characteristics relevant to efficiency evaluation, not on making a definitive ranking.
| Dimension | Infrared Heat Lamps | Radiant Heating Panels | Floor Heating (Electric) | Heated Mats / Pads |
|---|---|---|---|---|
| Heating mechanism | Concentrated radiant point source (infrared bulb) | Distributed radiant surface (panel) | Conductive + radiant from floor slab | Conductive + limited radiant (contact surface) |
| Typical uniformity | Poor — hot center, rapid falloff to edges | Good to excellent — uniform across panel area | Good — depends on element spacing | Moderate — edge losses significant on small pads |
| Power density controllability | Limited — on/off or dimming; fixed beam pattern | High — circuit-pattern-tunable distribution; zone control possible | Moderate — cable spacing determines distribution | Low to moderate — fixed mat shape |
| Installation type | Hanging fixture (ceiling/suspension) | Suspended or recessed ceiling mount | Embedded in floor / under slats | Floor-placed or creep-area mat |
| Energy efficiency considerations | High wattage concentrated in small area; effective watt density per m² of target zone is typically high | Lower effective watt density when coverage area is large; depends on uniformity and directional design | Long warm-up time; high thermal mass loses efficiency in ventilated environments | High per-m² power due to small size and edge losses |
| Safety considerations | High surface temperature; fire risk with bedding/dust; bulb breakage | Low surface temperature relative to lamps; no exposed hot filaments | Low surface temp; risk of floor cracking or moisture ingress | Electrical safety with animal contact and moisture |
| Maintenance profile | Bulb replacement (3–12 month life); fixture cleaning | Long element life; periodic surface cleaning | Very low maintenance; difficult to repair if element fails | Mat replacement if damaged; cable wear on surface |
Key takeaway — The right technology depends on the specific use case. Newborn piglets in small creep areas may have different requirements than grow-finish barns with large open floors. The goal of the evaluation framework in this guide is to help you compare options quantitatively — using the same metric (Effective Target-Zone Watt Density) and the same measurement method — rather than relying on marketing claims.
6. How to Benchmark Your Livestock Heating System
The following six-step method provides a practical way to evaluate any livestock heating system and compare it with alternatives on a consistent basis.
Step 1 — Define your target temperature window
Start by specifying the temperature range you need at animal level. This varies by species, age, and production stage:
- Neonatal piglets (0–3 days): typically 32–35°C at floor level
- Piglets (1–2 weeks): typically 28–32°C
- Weaners: typically 26–30°C
Document your target range clearly. This defines what counts as “in-spec” for your effective area calculation.
Step 2 — Measure actual input power
Use a calibrated watt-meter or power analyzer to measure the real power draw of the heating system at the supply line:
- For AC systems: measure true RMS power (W), not just current
- For systems with thermostats or cycling control: measure over a full on-off cycle and calculate average power
- Record line voltage at the time of measurement
Do not rely on the rated wattage on the label. Actual power can differ by 5–15% from the nameplate rating depending on line voltage and component tolerance.
Step 3 — Map the temperature distribution with a grid
This is the most important step — and the one most often skipped. Instead of measuring a single point, use a grid-based survey to capture the full temperature distribution:
- Define the measurement area (the full footprint you want heated)
- Lay out a measurement grid — the more points, the more accurate the result (e.g., 10 × 10 = 100 points for a rough survey; 24 × 10 = 240 points for detailed analysis)
- Use a calibrated temperature sensor array or thermal imaging system to measure receiving-plane temperature at each grid point
- Record all measurement conditions (ambient temperature, ventilation status, mounting height, floor type)
Practical tip — For a farm-level benchmark, you do not need 240-point precision. Even a 25-point grid (5 × 5) will give you a far more accurate picture of effective coverage than a single center-point reading. The key is to use the same grid layout for every system you compare.
Step 4 — Calculate the effective target-zone area
Count how many grid points fall within your target temperature window (Step 1). Then:
Effective Target-Zone Area = (Number of in-spec points ÷ Total grid points) × Total measurement area
For example: if 240 out of 240 points are ≥ 30°C on a 2.4 m² panel, the effective area = 2.4 m². If only 120 out of 240 points meet the target, the effective area = 1.2 m² — meaning half the heating area is not doing useful work.
Step 5 — Calculate Effective Target-Zone Watt Density
Apply the formula from Section 2:
Calculation — Effective Target-Zone Watt Density
= Measured Input Power (W) ÷ Effective Target-Zone Area (m²)
Lower is better — fewer watts per square meter of effectively heated area means higher efficiency.
Example calculation (from the 2.4 m² panel improved build):
- Measured input power: 210 W
- Total measurement area: 2.4 m²
- Points ≥ 30°C: 240 / 240 (100%)
- Effective target-zone area: 2.4 m²
- Effective watt density: 210 W ÷ 2.4 m² = 87.5 W/m²
Compare this number across different heating options. The system with the lower effective watt density delivers more effectively heated area per watt of input power.
Step 6 — Compare with alternatives on the same basis
When comparing with another technology, repeat Steps 1–5 under conditions that are as comparable as possible:
- Same ambient temperature (or normalize for it)
- Same target temperature window
- Same measurement grid density and sensor type
- Same mounting height category (adjust for technology-specific norms)
If conditions are not identical, document the differences and adjust your interpretation accordingly. The goal is not perfect laboratory precision — it is a fair, apples-to-apples comparison that gives you a reliable basis for decision-making.
Related engineering guide — Learn how we structure custom thermal validation grids in our Flexible Heater Prototyping Guide.
Need a hand with benchmarking? — Request a Technical Review — XIHE’s engineering team can help design a benchmarking protocol for your specific livestock heating application, including grid layout specification, measurement methodology, and comparative analysis.
7. Common Energy Efficiency Myths
When evaluating livestock heating options, watch out for these common misconceptions:
Myth 1 — “Lower wattage means more efficient”
Reality: Wattage tells you only the input, not the output. A 175 W lamp that effectively heats 0.4 m² has a higher effective watt density than a 210 W panel that heats 2.4 m². Always normalize by effective heated area.
Myth 2 — “High emissivity = high system efficiency”
Reality: Emissivity is a material-level property. System-level efficiency also depends on panel construction, directional insulation, uniformity, and installation. A high-emissivity heater with poor heat distribution still wastes energy.
Myth 3 — “Save X%” claims are reliable benchmarks
Reality: A “save 70%” claim without a stated comparison baseline and test method is meaningless. Was it compared with a 250 W incandescent heat lamp? With another panel? Under what conditions? Without these details, the number is marketing, not engineering.
Myth 4 — “Only the energy bill matters”
Reality: A heating system that runs at a lower effective watt density but creates cold spots can lead to animal performance issues that cost far more than the electricity savings. Conversely, a system with good uniformity and consistent temperature support can contribute to better feed conversion and more uniform growth. Efficiency must be evaluated in the context of heating performance, not in isolation.
Note on animal performance — This article focuses on thermal engineering evaluation. Animal health and growth performance outcomes depend on many factors beyond heating (nutrition, genetics, health status, management practices). Heating system decisions should be made in consultation with a qualified swine nutritionist or veterinarian.
Myth 5 — “All radiant heating panels perform the same”
Reality: Panel-to-panel variation in uniformity can be enormous. Two panels with the same rated wattage and the same surface area can have very different effective target-zone areas — because one has been engineered with edge compensation, optimized circuit patterns, and directional insulation, and the other has not. The construction quality and the design engineering behind the panel matter at least as much as the heating element itself.
8. FAQ
Are graphene heating panels more energy efficient than heat lamps?
There is currently no standardized head-to-head comparative test that would allow a definitive percentage-based claim. What we can say is that the right way to compare them is using the three-factor method and Effective Target-Zone Watt Density metric described in this guide — measuring input power, mapping the temperature distribution with a grid, and calculating watts per square meter of in-spec target area. This gives you an apples-to-apples comparison regardless of technology type. We provide a framework for doing this evaluation, and we can also assist with a technical review.
What is far-infrared emissivity and why does it matter for livestock heating?
Far-infrared emissivity measures how much of a surface’s energy is emitted as infrared radiation. Graphene heating film has a measured emissivity of 0.88 (NIQS certified, 5–15 μm band, material-level measurement). For livestock heating, this matters because infrared radiation transfers heat directly to animals and surfaces without heating the air in between — reducing energy lost to ventilation. However, emissivity is only one factor; panel construction, uniformity, and directional design also affect real-world efficiency.
How do you measure temperature uniformity in a heating panel?
Temperature uniformity is best measured using a grid-based method on the receiving plane (at the height where the animals are). The receiving plane is divided into a grid of measurement points (for example, 24 × 10 = 240 points for a large panel), and the temperature at each point is recorded. Uniformity is then expressed as the maximum temperature difference (max ΔT) across the grid, the percentage of points within a target window, or both. A lower ΔT and higher in-spec percentage means better uniformity.
How many watts do I need for piglet heating?
It depends on the area to be heated, the target temperature, the ambient barn temperature, the mounting height, insulation, and ventilation. Rather than starting with a wattage target, we recommend starting with your area and temperature requirements and then working backward to determine the appropriate heating system. If you send us your creep area dimensions, target temperature, and barn conditions, we can help evaluate your options.
What’s the difference between total electro-thermal efficiency and directional radiant efficiency?
Total electro-thermal conversion efficiency (typically >99% for resistive heating, material-level) measures how much of the input electricity becomes heat — essentially, how little is lost as electromagnetic noise or other non-thermal forms. Directional radiant efficiency (68% for graphene heating film, material-level, NIQS-tested) measures how much input electricity becomes useful forward-direction infrared radiation. The difference goes into conduction, convection, and backward radiation. At the system or panel level, the actual downward efficiency also depends on panel construction and backside insulation — not just the material properties.
How long do graphene heating panels last?
Material-level testing shows good thermal stability (less than 3.4% resistance change after 240 hours of continuous energization on bare film). However, the service life of a finished heating panel depends on many factors beyond the base material: the encapsulation type, operating temperature, duty cycle, environmental exposure (moisture, dust, chemicals), and the quality of electrical connections. Each application should be evaluated on its own conditions.
Can you help us compare heating options for our farm?
Yes. XIHE offers technical review services for livestock heating applications. We can help you evaluate different heating technologies using the benchmarking framework described in this guide, including grid-based temperature mapping methodology and Effective Target-Zone Watt Density comparison. Contact our engineering team to discuss your specific situation.
What is “effective target-zone watt density”?
Effective Target-Zone Watt Density is a metric that normalizes heating system power against the area that actually reaches the target temperature. It is calculated as: Measured Input Power (W) ÷ Effective Target-Zone Area (m²), where the effective area is the portion of the heating footprint where the receiving-plane temperature falls within the defined target window. Unlike simple wattage or watt-per-total-area figures, it accounts for the real thermal coverage of the system. Lower is better.
Do you offer on-site testing or energy audits?
We can discuss on-site or lab-based thermal performance testing on a case-by-case basis, depending on the project scope and location. The more typical engagement starts with a technical review — understanding your current heating setup, your performance targets, and your evaluation priorities — and then proposing the appropriate testing or analysis approach. Contact our team to discuss your needs.
What’s the best heating system for piglets?
There is no single “best” system for all situations. The right choice depends on your barn layout, creep area size, pig age range, ventilation setup, budget, and management style. Some operations find heat lamps adequate and flexible; others prefer panel heating for its uniformity and safety profile; still others use floor heating or heated mats. We recommend using the evaluation framework in this guide to compare options quantitatively based on your specific conditions.
9. Ready to Evaluate Your Heating System?
If you have read this far, you are likely already thinking about how to improve heating efficiency in your livestock operation. Before you start, here is a quick checklist to help you prepare:
- Define your target temperature window (based on animal age and production stage)
- Measure your current system’s actual power draw with a watt-meter
- Map the temperature distribution with at least a basic grid survey
- Calculate the Effective Target-Zone Watt Density for your current setup
- Identify your top 2–3 alternative heating options to compare
- Document your barn conditions (ambient temperature, ventilation, insulation, mounting height)
Even a rough benchmarking exercise will give you a clearer picture of where you stand than any marketing claim ever could.
What we can help with
If you would like a second pair of eyes on your heating evaluation — or if you are considering graphene heating panels as an alternative and want a proper comparative analysis — our engineering team can assist with:
Technical review: We review your current heating setup, your performance targets, and your measurement data, and provide an independent engineering assessment.
Thermal performance comparison: If you are evaluating multiple heating options, we can help design a fair benchmarking protocol and analyze the results using the Effective Target-Zone Watt Density framework.
Custom panel evaluation: For projects considering graphene radiant heating panels, we can provide design options and estimated performance based on your area, target temperature, and mounting conditions.
OEM vs. ODM guide — Evaluating custom manufacturing models? Read our Graphene Heating Film OEM vs. ODM Buyer’s Guide.
Request a Technical Review — Send us your current heating setup details, area dimensions, and target temperature. Our engineering team will review your application and come back with an assessment and recommendations — typically within 2–3 business days.
Download the Benchmarking Worksheet — A one-page PDF with the six-step benchmarking method, the Effective Target-Zone Watt Density formula, and a grid layout template. Use it as a practical tool when evaluating your livestock heating options.
XIHE develops graphene-based heating solutions for livestock, industrial, and commercial applications. All performance data cited is from specific test configurations and is provided for engineering evaluation purposes, not as a universal guarantee. Final specifications and project feasibility are confirmed on a case-by-case basis.
CONTINUE EXPLORING
Custom Graphene Heating Film | Flexible Heating Elements OEM | XIHE
Custom-shaped flexible graphene heating films for OEM applications. Customize geometry, voltage, power and heating patterns for product integration and mass production.
What Is Far Infrared Graphene? Technology, Emitter Architecture, and Evaluation
Far infrared graphene technology uses a graphene-based emitter to convert electrical input into far infrared radiant output. Learn how it differs from conventional heating elements, how to evaluate emitter architecture, emissivity, radiant efficiency, and supplier evidence.
What Is Far Infrared Graphene? Technology, Emitter Architecture, and Evaluation Articles
Browse all XIHE knowledge articles filed under what is far infrared graphene? technology, emitter architecture, and evaluation.
Partnership
Move from evidence review into OEM, sourcing, and commercial evaluation with XIHE.
Are Heated Eye Masks Safe? What Buyers Should Check First
Are heated eye masks safe? The practical answer depends on temperature control, session duration, face-contact materials, charging design, and whether the product is disposable or reusable.
Graphene Far Infrared vs Traditional Infrared Heating: What Actually Matters?
Not all infrared systems are equal. This comparison explains what buyers should actually compare: emissivity, radiant efficiency, wavelength behavior, thermal stability, and engineering consistency.